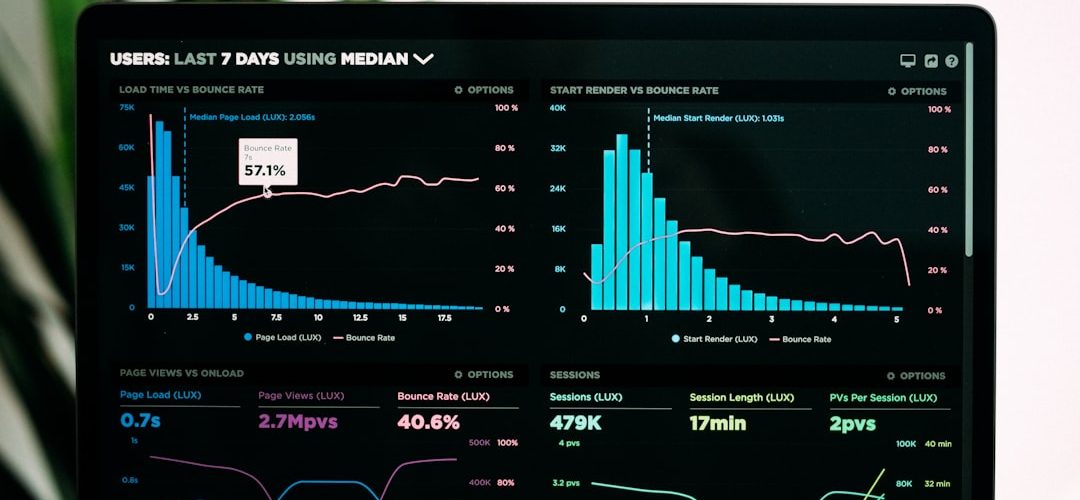
Boulevard is designed to help appointment-based businesses manage daily operations with greater visibility and control. For salons, spas, medspas, wellness studios, and similar service businesses, the dashboard is more than a scheduling screen; it is a command center for understanding performance, staff productivity, client behavior, and revenue trends.
TLDR: The Boulevard Dashboard gives managers a clear view of bookings, sales, client retention, staff performance, and reporting in one centralized workspace. For example, a spa manager might notice that rebooking rates dropped from 62% to 48% over 30 days and use that insight to coach front desk staff or adjust follow-up messaging. The strongest value comes from combining real-time operational data with longer-term analytics, so decisions are based on evidence rather than guesswork. Businesses that review these metrics consistently are better positioned to improve utilization, revenue, and client experience.
Understanding the Boulevard Dashboard
The Boulevard Dashboard is built to simplify complex business activity into accessible, actionable information. Instead of switching between disconnected spreadsheets, calendars, point-of-sale records, and client files, users can monitor essential data from one interface. This makes it especially valuable for managers who need to make quick decisions during busy service hours.
At a high level, the dashboard helps answer practical questions: How full is the book today? Which service providers are underutilized? How much revenue came from services versus retail? Are new clients returning? These are not abstract metrics. They directly influence staffing, marketing, scheduling, inventory, and client communication.
Core Features That Support Daily Operations
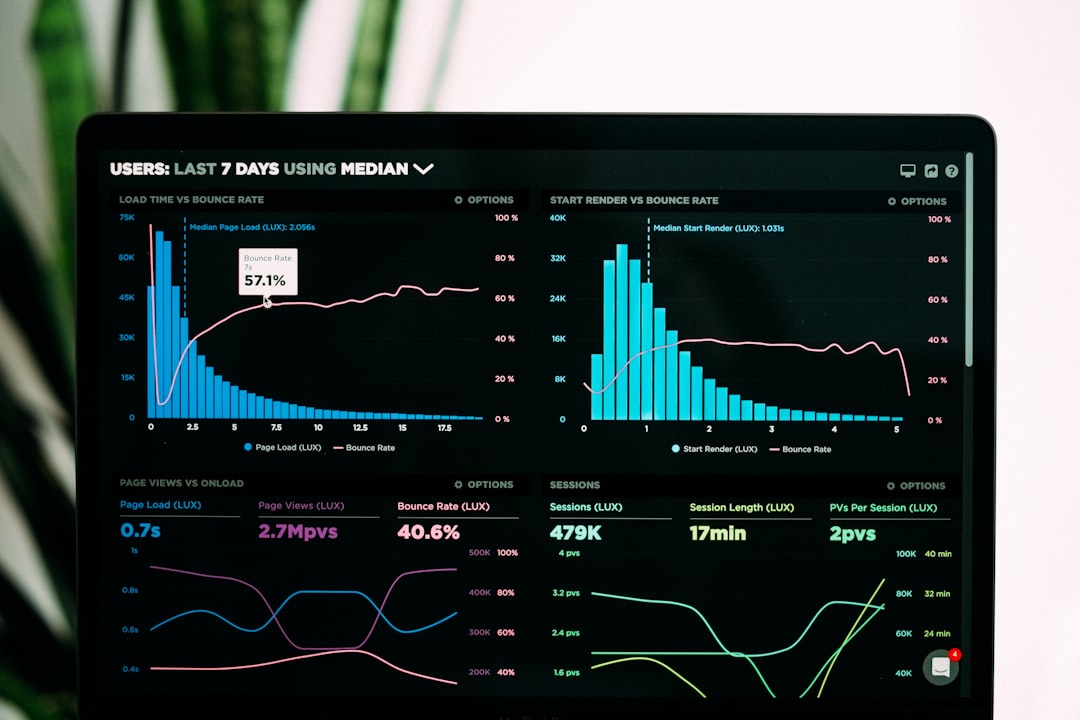
Boulevard’s dashboard is centered on operational clarity. While available tools may vary depending on configuration and user permissions, the most important features typically include appointment management, sales summaries, client activity, staff visibility, and reporting access.
- Appointment visibility: Managers can review the day’s schedule, appointment volume, cancellations, no-shows, and open time slots. This helps teams respond quickly to gaps in the calendar.
- Revenue tracking: The dashboard can show service sales, retail sales, tips, discounts, deposits, and other financial activity. This provides an immediate picture of business performance.
- Client insights: Users can evaluate new versus returning clients, visit frequency, purchase patterns, and rebooking behavior.
- Staff performance: Service provider productivity can be reviewed through metrics such as booked hours, completed appointments, sales totals, and client retention.
- Reporting shortcuts: Rather than navigating deep menus, managers can often access key reports directly from dashboard summaries or linked sections.
For owners and operators, these features reduce reliance on end-of-day manual calculations. For front desk teams, they support more informed conversations with clients, especially when scheduling follow-up appointments or recommending services.
Analytics That Matter Most
A dashboard is only useful if the numbers support meaningful action. Boulevard analytics should be reviewed with a clear understanding of what each metric says about the business. Looking at revenue alone is not enough. A business can have strong sales one week while quietly losing repeat clients or overloading top-performing staff.
Booking rate is one of the most important indicators. If available appointment hours are not being filled, the business may need stronger marketing, better online booking visibility, or revised staff schedules. A utilization rate of 75%, for example, may be healthy for a growing location, while a mature business may expect closer to 85% or higher depending on service type and staffing costs.
Client retention is equally important. New client acquisition is valuable, but repeat visits usually create more stable revenue. If first-time clients are not returning within a reasonable period, the issue may involve service experience, pricing, post-visit communication, or rebooking discipline.
Average ticket value helps determine whether each appointment is maximizing its revenue potential. This metric can increase through appropriate add-on services, retail recommendations, packages, or memberships. However, it should be interpreted carefully. Higher ticket values are useful only when they align with client trust and long-term satisfaction.
Staff productivity connects individual performance to overall business health. A provider with strong technical skills but low rebooking may need client communication support. Another provider with high retail sales may be a good example for team training. The dashboard helps identify these patterns without relying entirely on anecdotal feedback.
Reporting for Better Business Decisions
Reporting turns dashboard data into structured business intelligence. While the dashboard is useful for quick snapshots, reports help identify trends over weeks, months, quarters, or years. This distinction matters because one slow day may not be alarming, but a six-week decline in weekday bookings requires attention.
Common reporting categories include:
- Sales reports: Break down revenue by service, retail, category, location, date range, or staff member.
- Appointment reports: Show completed bookings, cancellations, no-shows, and schedule utilization.
- Client reports: Track retention, new client growth, client frequency, and purchasing behavior.
- Staff reports: Compare provider performance, productivity, sales contribution, and rebooking rates.
- Inventory or retail reports: Help monitor retail movement, best sellers, and potential stock issues.
Strong reporting habits help leadership avoid reactive decisions. For example, if retail revenue appears low, a sales report may show whether the issue is isolated to one product category, one location, or one team shift. That level of detail prevents broad assumptions and allows for targeted action.
How to Use Dashboard Data Responsibly
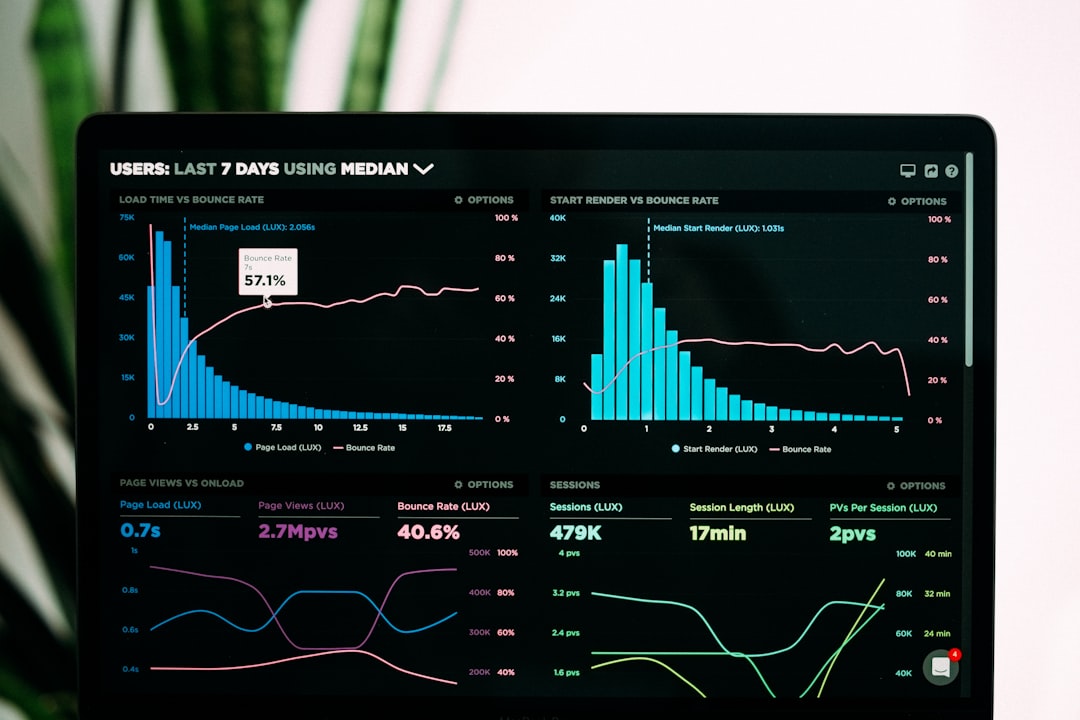
Data should guide decisions, not replace professional judgment. A serious approach to Boulevard analytics means looking at context before drawing conclusions. A drop in revenue may be linked to seasonality, staff vacation, local events, weather, or reduced hours. Similarly, a provider with fewer bookings may be new to the team or assigned to specialized services with longer appointment times.
It is also important to avoid overwhelming staff with too many metrics at once. A practical approach is to focus on a small group of key performance indicators, such as utilization, rebooking rate, average ticket, retail attachment, and client retention. These figures are broad enough to reflect business health but specific enough to support action.
Managers should review daily numbers for operational needs, weekly numbers for coaching, and monthly numbers for strategic planning. This rhythm keeps data relevant without turning reporting into a burden.
Example User Case Scenario
Consider a medspa with six service providers and an average monthly revenue of $120,000. The manager reviews the Boulevard Dashboard and notices that overall utilization is strong at 82%, but new client retention is only 41%. At the same time, staff reports show that two providers are retaining new clients at more than 60%, while others are below 35%.
Instead of assuming the issue is pricing or marketing, the manager investigates service notes, checkout behavior, and rebooking practices. The data shows that high-retention providers consistently recommend a next appointment before checkout. The business then trains the entire team on consultation language and follow-up timing. Over the next quarter, new client retention rises to 52%, creating more predictable revenue without increasing advertising spend.
Best Practices for Dashboard Review
- Start each day with schedule review: Identify open time, high-demand periods, and possible staffing pressure.
- Track cancellations and no-shows: Repeated patterns may indicate policy, reminder, or booking-process issues.
- Compare service and retail performance: A healthy business often needs both strong service delivery and appropriate product recommendations.
- Review staff metrics with context: Use data for coaching and support, not punishment.
- Set monthly benchmarks: Define realistic targets for utilization, retention, revenue, and client growth.

Final Thoughts
The Boulevard Dashboard is most effective when used as part of a disciplined management process. Its features bring together scheduling, revenue, client, and staff information, while its analytics and reports help leaders understand what is happening beneath the surface. The goal is not simply to collect data, but to turn it into better decisions.
For service businesses where appointment time, client loyalty, and staff performance directly affect profitability, dashboard visibility is essential. By reviewing the right metrics consistently and interpreting them with care, owners and managers can improve operations, strengthen client relationships, and build a more predictable business.